

Summary at a Glance
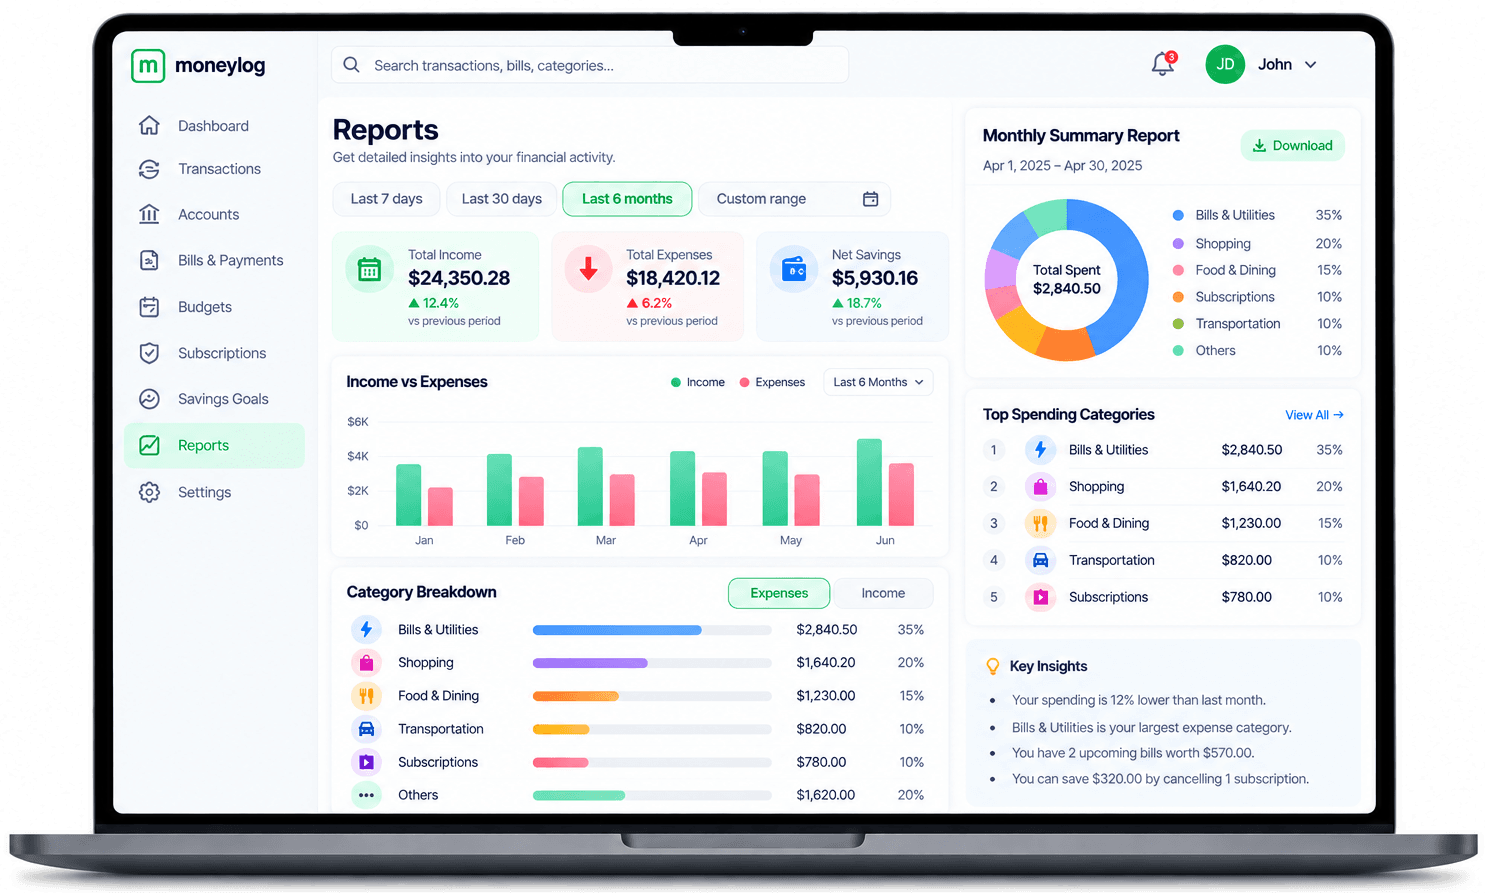
Total income, total expenses and net savings — with the change against the previous period.
- Total Income
- $24,350+12.4%
- Total Expenses
- $18,420+6.2%
- Net Savings
- $5,930+18.7%
View detailed reports for your bills, transactions, subscriptions and loans. Filter by date range, account or category and get the insights you need to make better financial decisions.
Bills, subscriptions, loans, transactions & more.
Select date range, account and category.
See exactly where your money goes.
Available Reports
Every report is built from your own activity, so the numbers you see are always up to date.
View all upcoming bills, due dates and amounts for the selected account.
Track your recurring subscriptions and the dates they renew.
Monitor EMI payments, outstanding balance and upcoming due dates.
A detailed list of all your transactions, grouped by category.
Understand your spending patterns and your biggest categories.
Build your own view with the dates, accounts and categories you care about.
Inside Every Report
Pick a period and moneylog puts your totals, trends and breakdowns side by side — no spreadsheets, no manual maths.
Total income, total expenses and net savings — with the change against the previous period.
Compare what came in against what went out, month by month.
See how much each category takes, ranked from the biggest spend down.
Plain-language takeaways pulled from the numbers, so you know what to do next.
Get to the right report in just a few clicks.
Pick from bills, transactions, subscriptions, loans and more.
Set the date range, account and category you want to look at.
See totals, trends and breakdowns together in one clear view.